
Expressly stated in the August 14 air-registration application.
Visual evidence · scale references
What 1,326 MW and 48 gas turbines could look like
Pacifico's released air application identifies six turbine families and 48 units but does not provide a final public rendering of the complete built configuration. These operating facilities, thermal footage and labeled illustrations remain useful scale references.
Content reviewed October 1, 2026 · Evidence dates appear with the records.
What the application says
A 48-turbine application, but no final public equipment picture
Pacifico's air application identifies 48 simple-cycle natural-gas turbines across six model families and expressly states 1,326 MW of maximum nominal output. The earlier conceptual plan does not depict a matching final unit schedule, so it remains a planning reference—not a final rendering.
A visual count of repeated bays—not a certified equipment schedule or proof of unit ratings.
Baker Hughes NovaLT16; Solar PGM70, SMT60 and Titan T-130; GE Frame 6B; and Ansaldo AE64.3A.
Optical gas imaging


What turbine exhaust looks like through an infrared camera

Combustion exhaust is mostly invisible to the naked eye. Certified thermographer Sharon Wilson of Oilfield Witness recorded these three clips at xAI’s Memphis facility on May 13, 2025 with a Teledyne FLIR G620 camera designed for hydrocarbon gas imaging.
A second certified reviewer—a 28-year TCEQ veteran—described “huge lofting and significant emissions that extend far beyond the facility’s physical footprint … from at least 13–15 hot turbines.”
Independent review quoted by Oilfield Witness
Thermal drone investigation

What a full turbine yard looks like from above
Floodlight investigative producer and FAA-licensed drone pilot Evan Simon recorded this thermal view during the newsroom’s January 2026 investigation of xAI’s Southaven, Mississippi, power plant. The aerial perspective shows rows of hot stacks and their combined exhaust plumes serving one data-center complex.
Fair-comparison note
Visible plume behavior is not the same as measured pollution.
The Memphis units shown here were temporary and operated without the permitted SCR and CO oxidation-catalyst controls Pacifico says it will use. Those systems can substantially reduce—but do not eliminate—NOx and CO. OGI and thermal footage show the existence, heat, movement, and collective scale of exhaust; they do not quantify pollutant concentrations or predict exposure at Cedar Creek.
Read Floodlight’s drone-method accountScale
How big is 1,326 megawatts?
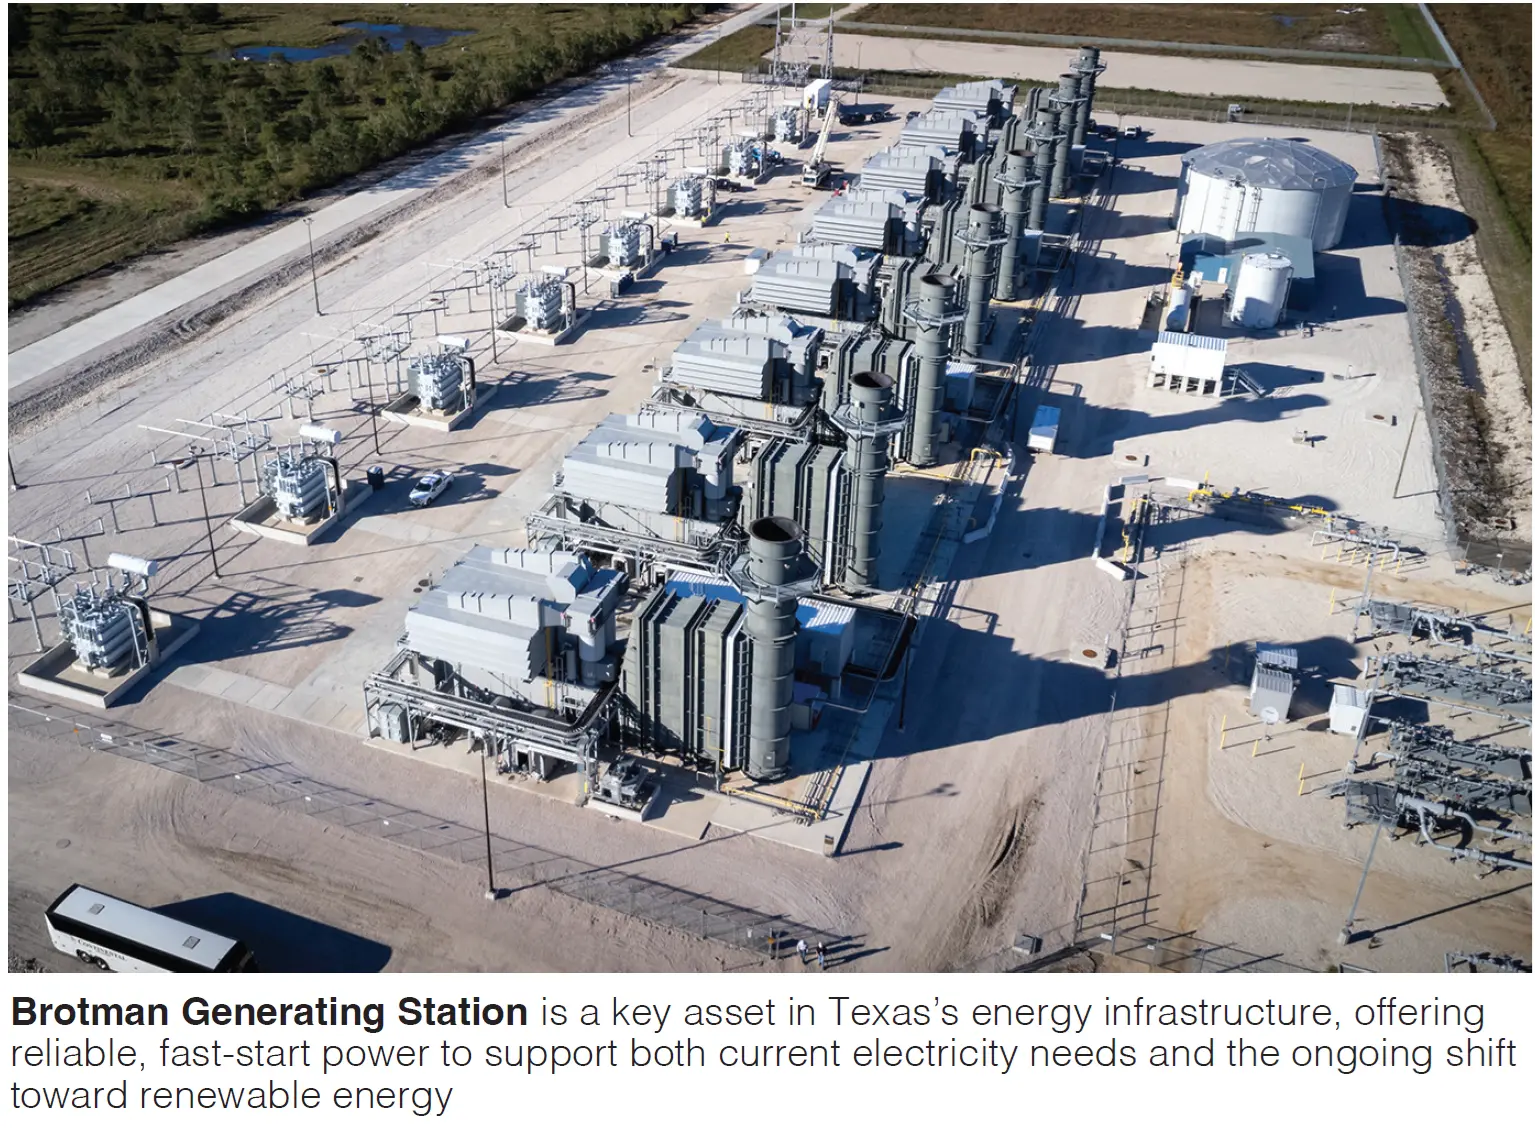
Brotman Generating Station is a 288 MW Texas simple-cycle peaker with six turbine packages. Pacifico's application states about 4.6 times that generating capacity and identifies 48 turbines—eight times Brotman's unit count, although the models and ratings differ.
Operating as primary on-site power for a data center.
A separate Virginia proposal reported by PEC.
A moving real-world reference for a large turbine fleet.
Brotman Generating Station288 MW · six LM6000 packages · Brazoria County, Texas
Real facilities
The same industrial vocabulary, photographed
The photographed operating plants use air permits and emissions controls; the Hubbard image is a developer rendering of a proposed campus. Most grid peakers run intermittently. A behind-the-meter plant following a large computing load may run far more often, as Vantage VA2 does. Pacifico’s operating profile remains unknown.
Brotman Generating Station — Brazoria County, Texas
The closest Texas visual analog in this set: a 288 MW simple-cycle peaker with six LM6000 gas-turbine packages, individual enclosures, emissions-control structures, and exhaust stacks. Pacifico's application states about 4.6 times its total generating capacity and identifies eight times as many turbine units. The repeating equipment, piping, and service areas show how quickly a modular turbine yard becomes an industrial campus.
Photo: ProEnergyOpen source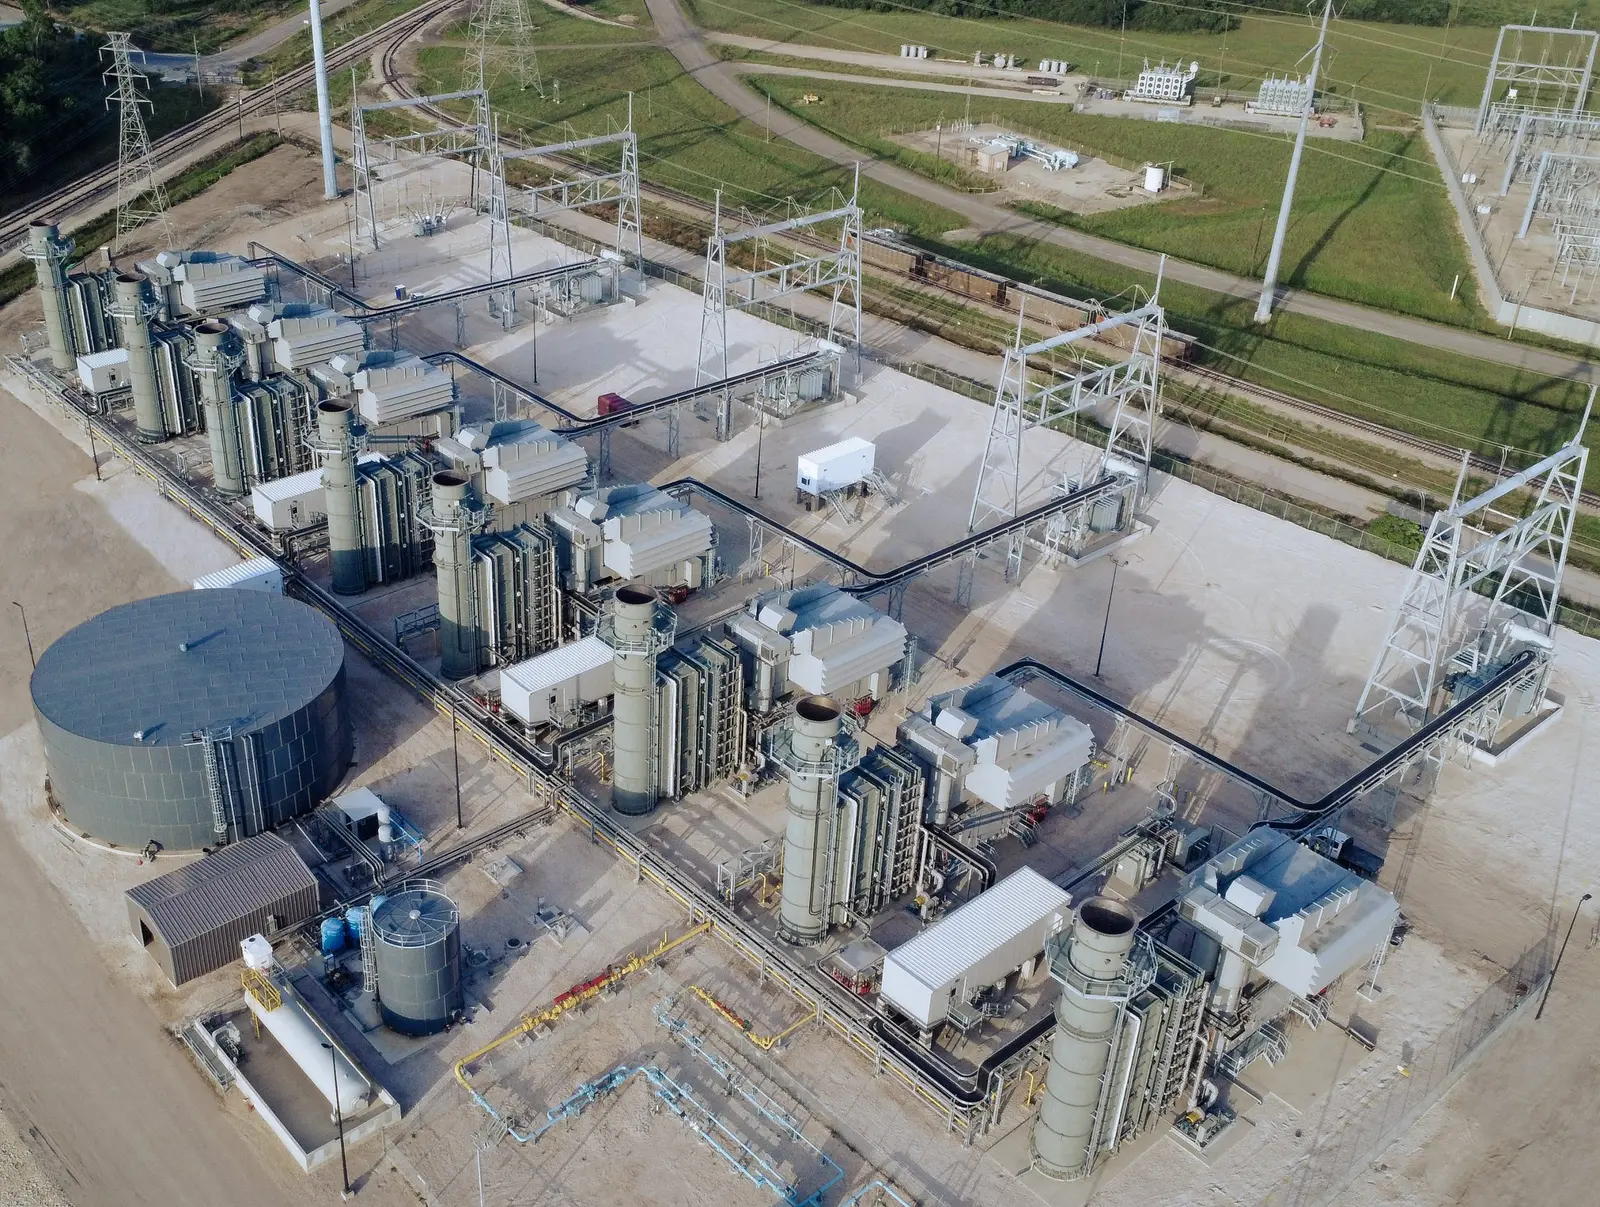
Brotman Generating Station — close view
A closer view shows turbine enclosures, emissions-control and exhaust structures, fuel-gas equipment, water storage, and an on-site substation—many of the same equipment categories named in Pacifico’s filing.
Photo: ProEnergyOpen source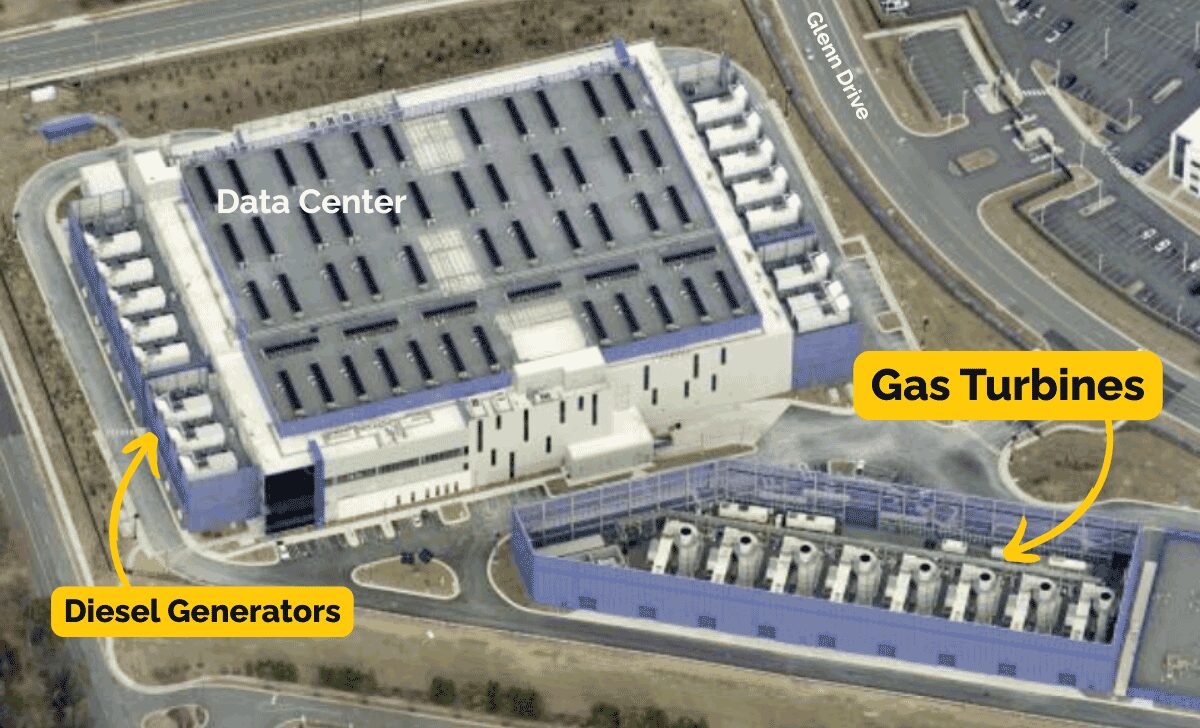
Vantage VA2 Data Center — Sterling, Virginia
An annotated satellite view of a hyperscale data center with eight natural-gas turbines and permitted diesel backup generators co-located on campus. It is a real, approximately 100 MW behind-the-meter configuration operating around the clock beside residential land use. Pacifico’s stated maximum nominal output is roughly thirteen times larger.
Image: Piedmont Environmental CouncilOpen source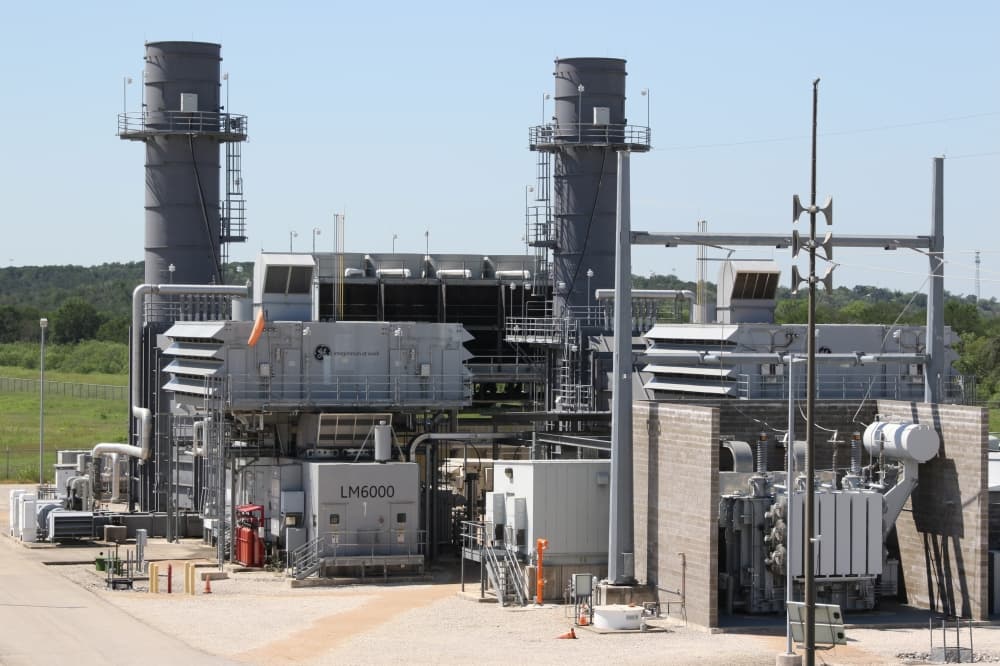
GE LM6000 units — Sand Hill Energy Center, Austin
A ground-level simple-cycle reference roughly 15 miles from Cedar Creek. Austin Energy’s station includes six LM6000 peaker units within a larger gas-generation site. Pacifico’s released application does not list LM6000s; it identifies 48 units across Baker Hughes, Solar Turbines, GE and Ansaldo model families. The photo remains useful for general industrial scale, not as a claimed Pacifico equipment match.
Photo: Community Impact / Austin EnergyOpen source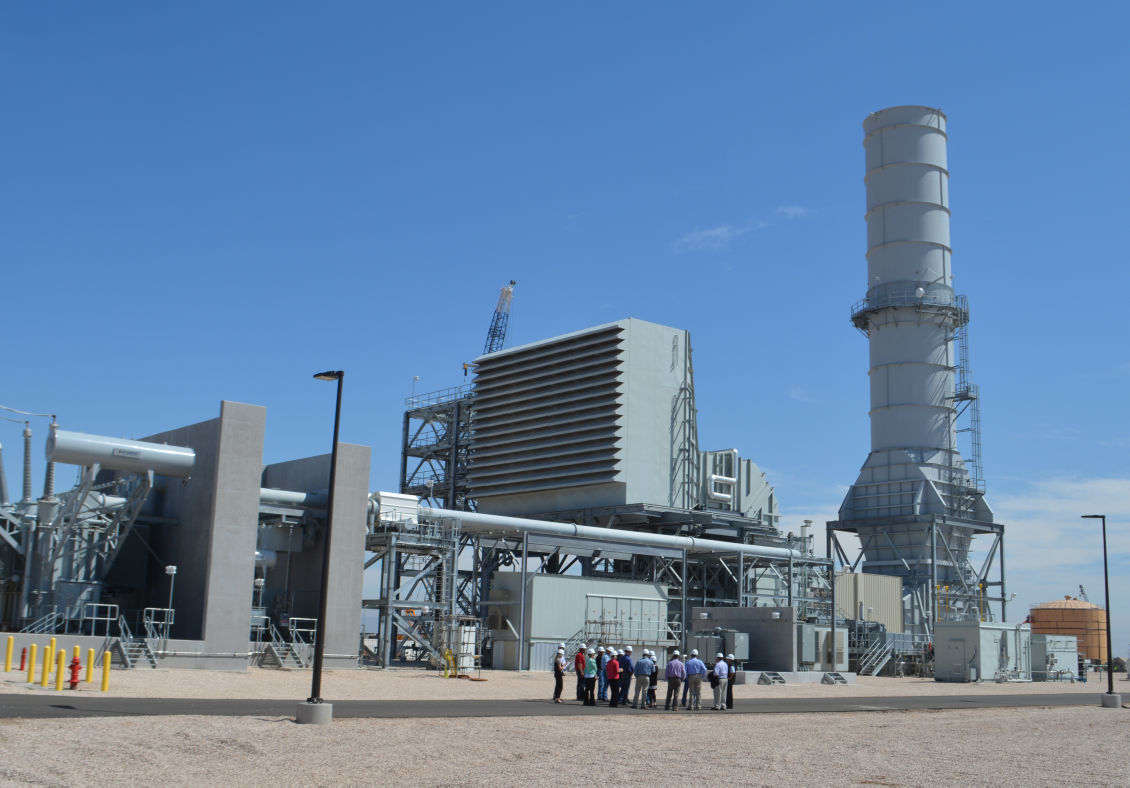
Elk Station — Abernathy, Texas, at human scale
A tour group beside a simple-cycle unit conveys physical scale better than an aerial photograph: the air-intake structure, turbine equipment, controls, and exhaust stack tower over the people below. This is a larger frame-type unit, not an assumed Pacifico model, but the basic industrial anatomy is comparable.
Photo: Golden Spread Electric CooperativeOpen source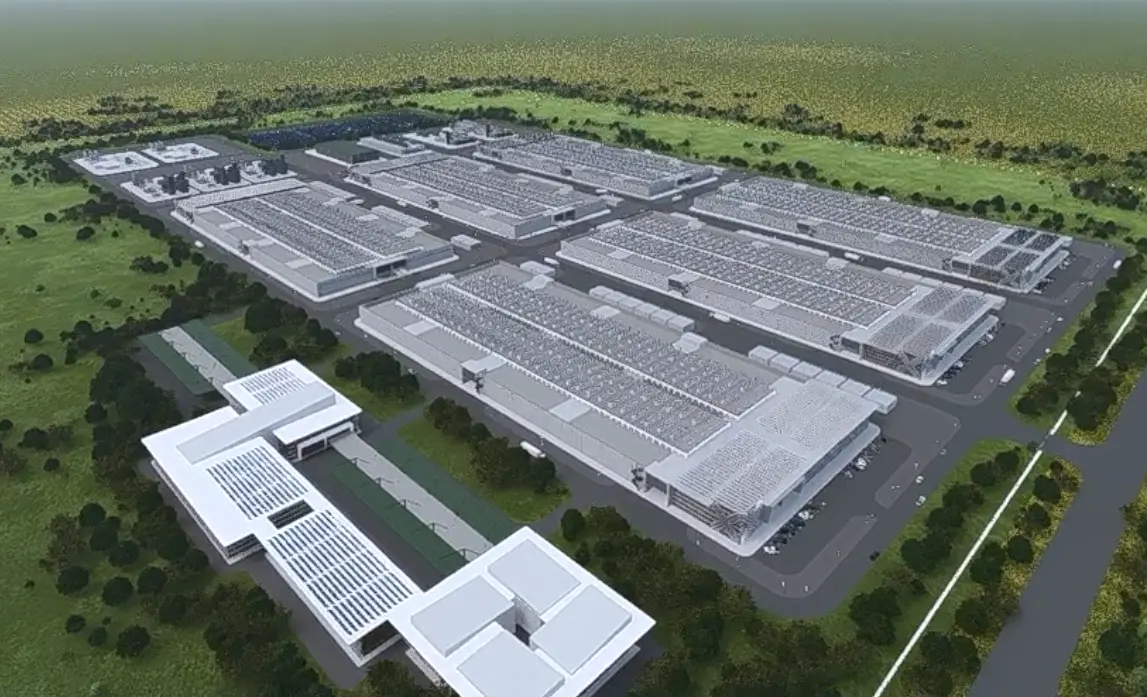
Proposed 600 MW gas-powered data center — Hubbard, Texas
A developer rendering of a 600 MW whole-campus concept—less than half the maximum nominal output stated in Pacifico’s air application. Data-center halls dominate the site while the gas-generation plant occupies one portion; cooling, roads, electrical equipment, and supporting infrastructure fill much of the remaining developed footprint.
Developer rendering via Data Center DynamicsOpen sourceAbout this visual record
References, not a substitute for final engineering
The conceptual layout provides a physical arrangement but does not itself specify a certified turbine count, models, ratings or operating schedule. A visual count finds 32 apparent repeated positions. The released air application separately identifies 48 turbines across six model families and 1,326 MW of stated maximum nominal output. The capacity comparisons below remain illustrations rather than predictions; final procurement, layout and approved operating terms remain unresolved.
Images are credited to their sources. Real facilities, source footage, developer renderings, and AI-generated illustrations are labeled separately so visual force does not become false certainty.